Learning Lab - Future Transport Systems
The Learning Lab - Future Transport Systems (L2-FTS) is an integrative platform to bring together SCCER Mobility research groups and commercial partners. It addresses the development of future technologies and new business models under dynamic policy conditions as well as their impact on the future states of the transport system in Switzerland. The L2-FTS is involved in different research and integrative activities. It conducts research on the current state and future developments of the Swiss mobility system, with a special focus on new technologies in both rail and road freight transport.
Dr. Amin Dehdarian
Learning Lab Future Transport Systems (L2-FTS)
ETH Zürich - Institute of Energy Technology
dehdarian@lav.mavt.ethz.ch
044 633 99 52
Dr. Albert Mancera Sugrañes
Learning Lab Future Transport Systems (L2-FTS)
ETH Zürich - Institute of Energy Technology
albert.mancera@lav.mavt.ethz.ch
044 632 31 64
Learning Lab Future Transport Systems (L2-FTS)
ETH Zürich - Institute of Energy Technology
mireia.roca-riu@sccer.ethz.ch
044 632 47 38
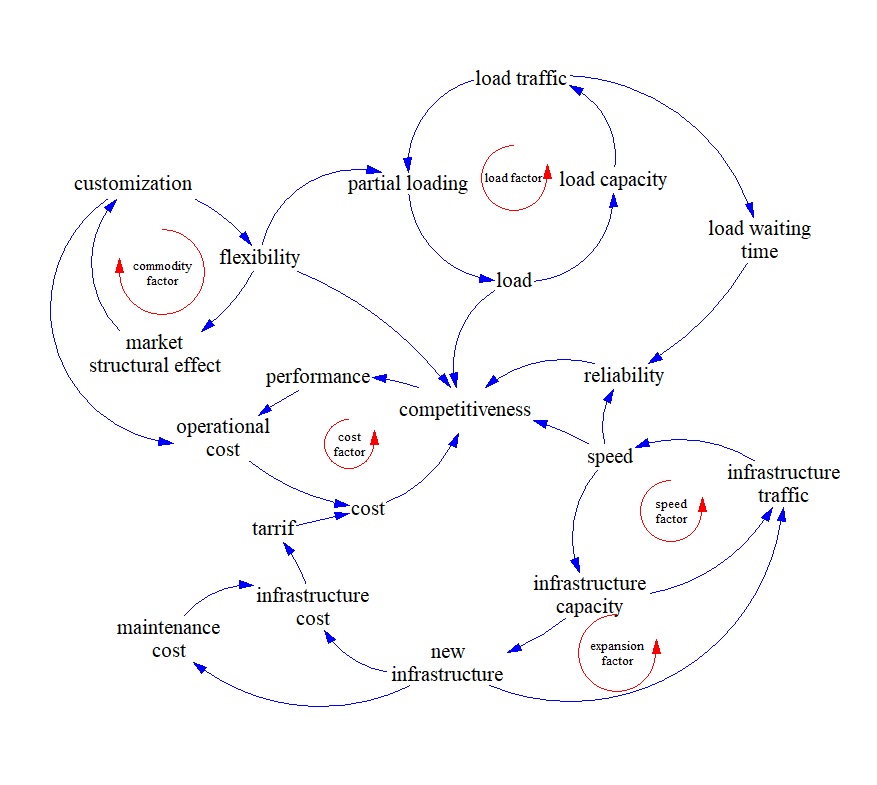
In this collaborative research project with SBB Cargo, the L2-FTS investigates the future competitiveness of rail freight transportation compared to road freight. It investigates the future technological develop-ments, especially the electrification of road freight transport, and the impact of different policies on the development of specific technological trajectories. A model of the freight transport system in Switzerland is developed to analyze the potential impact of future technologies and system interventions, including vehicle electrification, automation, digitalization and policy-making. The freight transport system is regarded as a complex socio-technical system, where the technological infrastructure (the physical layer) is the context of actor interactions (the social layer) leading to transport patterns and dynamic behaviors. The structure of modal choice is revealed as a substantial factor behind the transport system behavior in the form of interconnections and feedback loops. The interaction of these different loops, shapes the behavior of competitiveness as the main parameter behind modal choice.
Figure: An example of causal loop diagram (CLD) of transport modes.
Download figure as pdf
In addition, the L2-FTS contributes to the integrative assessment of SCCER Mobility projects by developing tools to evaluate the current state of research activities and highlighting potential directions of future joint research projects and other tools in order to facilitate interaction among SCCER Mobility members.
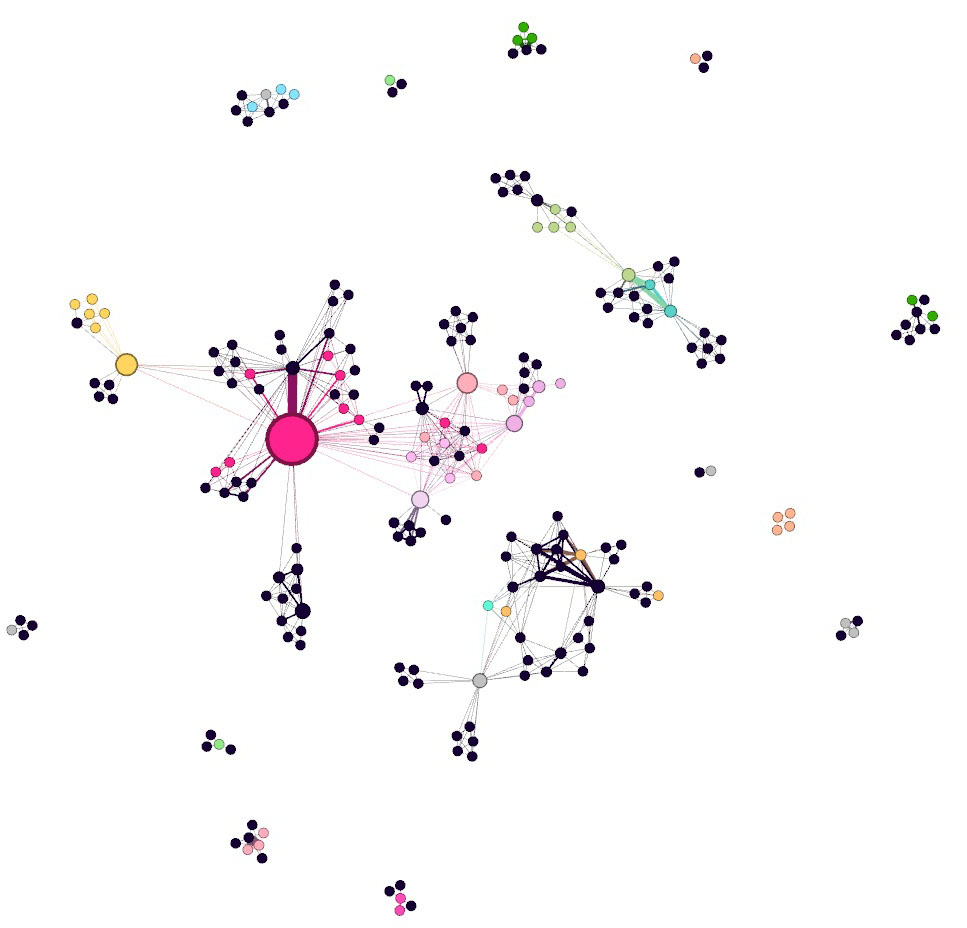
Documented data on the past and present state of research projects and collaborations are used to analyze the network of interactions by using social network analysis (SNA) techniques. The following figure shows an example of the preliminary SNA results based on the co-authoring activities of SCCER Mobility members to analyze emerging clusters of collaboration. Each member represents one researcher, while the colors show research teams. Node size represents betweenness centrality, a measure of moderating scientific collaboration between other researchers and each link implies co-authoring one single publication, while link thickness means co-authoring more than one publication.
Figure: An example from the preliminary SNA results based on SCCER Mobility publications 2017.
Download figure as pdf
L2-FTS efforts also include benchmarking research and demonstration projects on the development of different transport technologies all over the world, and the dynamic modelling of emissions by the decomposition of the Kaya identity for freight transportation.
This benchmarking is done based on the data collected by the International Council on Clean Transportation (ICCT) and published in the white paper entitled “Transitioning to zero-emission heavy-duty freight-vehicles” (September 2017). Based on this report, the benchmarking can be done based on two different categories of demonstration projects and commercial products.
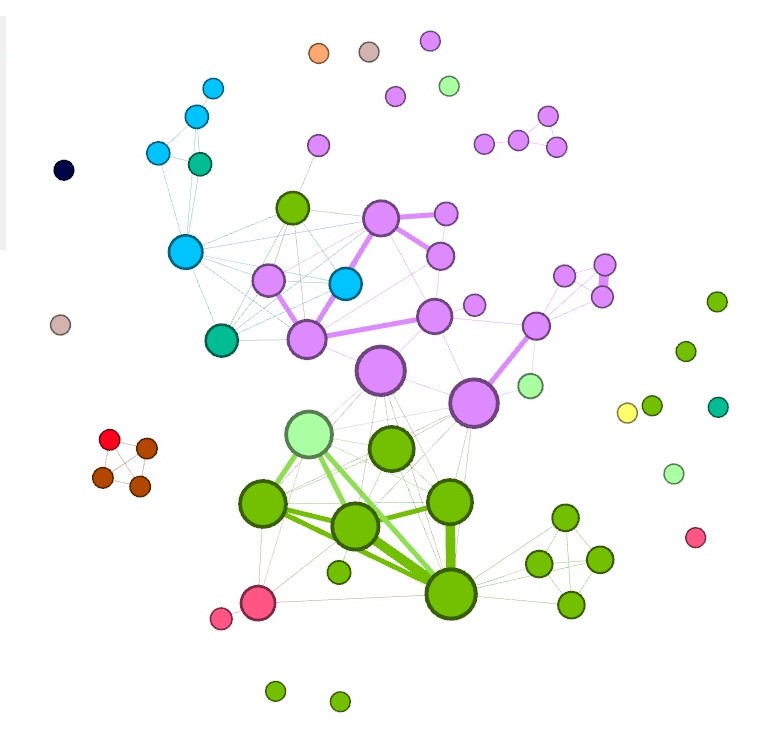
For the first part of analysis, demonstration projects are investigated. These are the projects aiming to reduce the cost and performance barriers of zero-emission truck projects. The following figure shows a preliminary analysis of the results. Each node represents a demonstration project. The network shows the emergence of the giant component (the largest connected part of the network), mainly composed of the demonstration projects of three countries, namely the United States, Germany and the Netherlands. Node size represents the eigenvector centrality, a proxy for the relative importance of individual nodes based on their moderating role in the network and connection to other important projects.
Figure: The preliminary analysis of benchmarking demonstration projects on the electrification of road freight transport (node size represents eigenvector centrality).
Download figure as pdf
!!! This document is stored in the ETH Web archive and is no longer maintained !!!